Standardized XBRL Financial Data - [Why It Matters and How We Fix It]
If you want to find out what Tesla's market capitalization was over the past ten years, and you want to access that data via API, it seems like it should be cheap and straightforward to do so. If you're a developer and you're looking to get the Oil Industry's performance charted on your website, it seems like accessing that data should be a no brainer. Thanks to a technology called XBRL, this has become easier over the past several years.
The truth is, there is a whole world operating behind the scenes of financial data feeds. There are professionals, companies, industries, governmental bodies, and hundreds of thousands of employees working to deliver your historical market cap.
There aren't many options for accessing this data. The options that do exist are prohibitively expensive for two reasons.
- Financial data in its raw form requires normalization
- Current normalization methods are manual and outdated
We'll get into #1 soon, but let's start by walking through current methods. We'll take financial statement data as an example (revenues, expenses, net income, etc. for companies like AAPL and XOM).
Here is how much of that data is currently sourced, cleaned up, and distributed via API to your application:

If you think this seems unnecessary, inefficient, and costly - you're right. It's why your Bloomberg Terminal costs thousands of dollars a month. The good news is that a new technology called XBRL has made part of this much easier. XBRL isn't leveraged to its full capacity by the large data firms, which is why their prices have remained high.
So what exactly is XBRL?
From the Financial Accounting Standards Board (FASB):
XBRL, or eXtensible Business Reporting Language, is an XML standard for tagging business and financial reports to increase the transparency and accessibility of business information by using a uniform format.
The US GAAP Financial Reporting Taxonomy is a list of computer-readable tags in XBRL that allows companies to label precisely the thousands of pieces of financial data that are included in typical long-form financial statements and related footnote disclosures. The tags allow computers to automatically search for and assemble data so those data can be readily accessed and analyzed by investors, analysts, journalists, and the SEC staff.
(Translation?)
XBRL means that every line of a financial statement has a digital tag. This digital tag makes it very easy to access individual data points or whole filings from public sources.
The Bright Side of XBRL
The difference between a PDF financial statement and an XBRL financial statement is monumental. With the advent of the information age, there is no longer an excuse to be filing financial information in a PDF. XBRL has fundamentally improved the accessibility and transparency of financial data.
The benefits go far beyond easier, faster, cheaper access to data for evaluating investment opportunities. We are talking about a unified, standardized, global language for business communication. The applications aren't restricted to external reporting. China is already ahead of the United States in leveraging XBRL internally (think inventory management, CRM, etc.) and the possibilities in those areas are incredibly exciting.
The Dark Side of XBRL
Making data digitally accessible is a huge hurdle in itself. However, there is a major problem with XBRL: it's not normalized.
What does that mean?
There are roughly 8,000 publicly traded companies in the United States and, even though they all use XBRL, none of them file their financial statements in the same way. There is a rough outline for how an income statement should look, for example: revenues - expenses = net income. But obviously there are way more than 3 line items on a statement. The XBRL taxonomy provides guidelines on how a company should file, and which XBRL tags they should use for each line item.
Depending on the industry, time period, product suite, and many other factors, companies file their financial statements in wildly different ways. For example, the taxonomy allows for something called extensions. What this means is that if you don't like the tags you can make up your own. So of course, everybody makes up their own tags.
Here are Three Examples of Just How Unusable This Data Can be:
Revenue Mismatches Due to Extensions
ORCL is a great case for demonstrating how horribly incomparable XBRL data can be. ORCL lists 6 line items under their revenues section - they have business in cloud software & infrastructure, cloud software, and hardware - and they choose to represent their income this way.
AAPL chooses to report their revenues much more simply, with one distinction between product and service revenue.
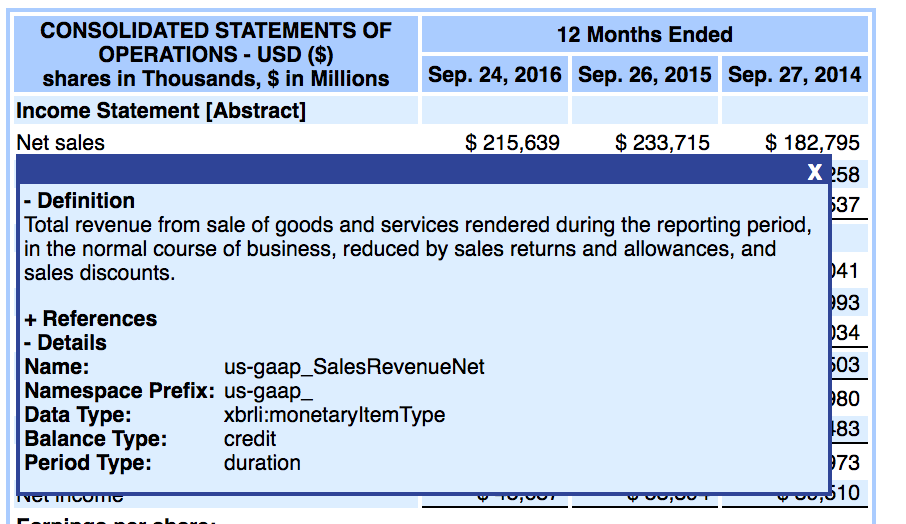
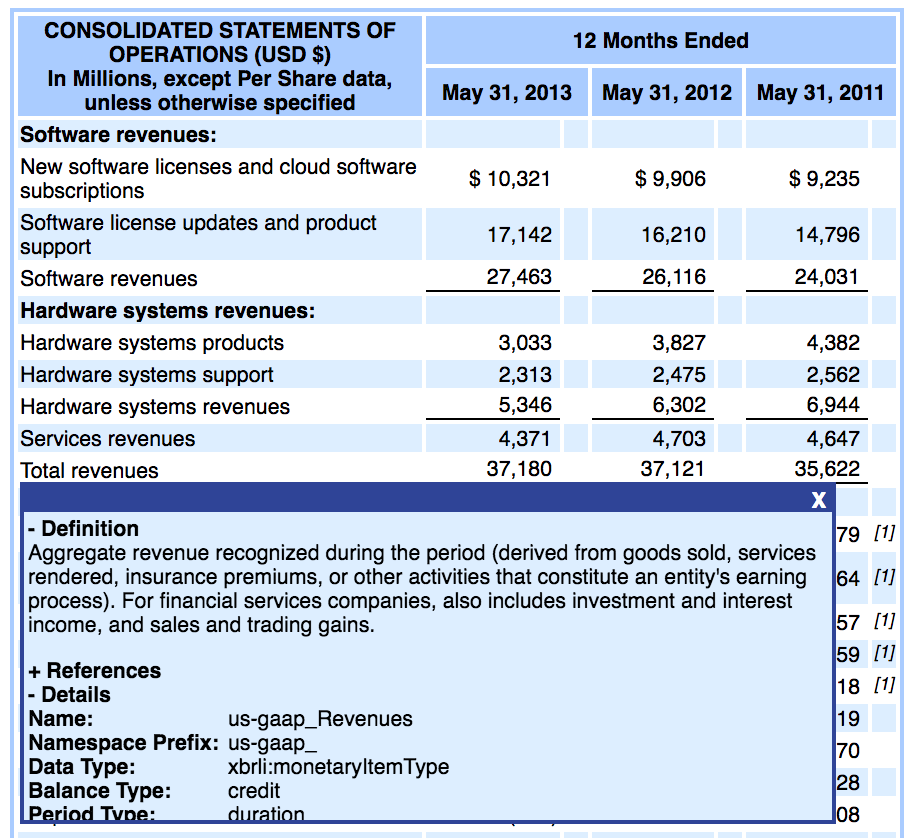
How is it possible to compare one company's revenues to another when the tags are different? How do you even know what to search for? It's really difficult, if not impossible to compare one company to another when the XBRL tags differ this much.
Mixing Up Positives and Negatives on the Cash Flow Statement
Another more fundamental issue that has been explored extensively by the academic community has been the complex nature of statement line item values and their relationships to other line items on financial statements.
In XBRL, the relationships are modeled in the calculation linkbase, which is a component of an XBRL filing which has the sole purpose of explaining relationships between tags in the context of a certain statement.
The complexity stems from the various embedded meta-data, such as the debit or credit nature of a line item and XBRL tag, with the positive or negative value represented in the filing.
This issue has been found in nearly all aspects of XBRL filings, but is most profound on the Statement of Cash Flows. For example, the "children" line items must sum to equal the Net Cash Provided by Operating Activities.
If a company mixes the debit or credit nature of the XBRL tag with the appropriate positive or negative value, it may cause the summation of all line items to not equal this summation line item.
When pulling this data purely by machine readable means, this means there will be misrepresentations that could cause an analysis of the data to suggest something that might not be true.
Changing XBRL Tags Over Time Periods
Below are two images of ORCL's XBRL tag for Net Income over two different time periods. The first shows the XBRL tag as:
us-gaap_NetIncomeLossAvailableToCommonStockholdersBasic
and the second shows the XBRL tag as:
us-gaap_NetIncomeLoss


If ORCL changes individual tags like this over time periods, how is it possible to compare ORCL's performance in more than one time period? It's not - without a ton of manual work.
These examples are simplistic representations of the various issues inherent in the "as reported" XBRL data and illustrates the necessity for a standardization process to ensure comparability - not just between companies, but even across time periods as well.
Here's What's Being Done About it
Intrinio
The good news is that you don't have to worry about XBRL issues like the ones listed above. That's what we do at Intrinio - and we do it well.
We have developed a technology that maps all of the XBRL data to a standardized syntax. This means you can compare companies easily to each other, and you can compare one company's financials over time. Since this technology is algorithmically based rather than manually executed, the data is delivered to you faster than ever before.
Our technology spends all day pulling in SEC filings and using machine learning to detect and correct errors like the ones outlined above. The system is getting smarter each day.
We are members of XBRL US and we're excited to be part of the movement. While we're thrilled with how far the XBRL technology has come, there are still issues that make the data unusable for many investors and developers. Our goal is to take care of all the messy parts of data collection and standardization so that our users have fast, accurate and easy-to-use data at their fingertips.

XBRL International & XBRL US
XBRL International is a not-for-profit and functions as the voice of this industry. Their staff is dedicated to the promotion, adoption, and use of XBRL, in addition to developing and maintaining the XBRL standard and related specifications. XBRL International does a fantastic job of educating users, consumers, and filers as well as hosting events and conferences.
There are member branches in dozens of countries, including XBRL US, where Intrinio is a member. XBRL US has formed the XBRL US Center for Data Quality to address concerns about, and to improve the utility of, XBRL financial data filed with the U.S. Securities and Exchange Commission (SEC).
If you're interested in getting involved, contact your local branch. We'd love your help promoting the future of financial reporting.
Data Coalition
The Data Coalition advocates on behalf of the private sector and the public interest for the publication of government information as standardized, machine-readable data.
This membership-based trade association unites companies, non-profit organizations, and individuals in an effort to promote transparency and machine-readable data. XBRL is one of the main efforts in this mission.
The Data Coalition has less of a focus on the quality of financial data and is more involved with promoting the expansion of XBRL. This is also fundamentally important to the future of finance and investing. More information filed in a machine-readable format means more transparent markets, and a wider breadth of quality data for your research.
SEC
In 2009, the SEC officially mandated that every publicly traded company must file their financial reports in XBRL format. We have them, and countless other organizations who promoted XBRL, to thank for the ease of access to financial information that we currently enjoy.
As the regulatory body governing the filing of XBRL-based financial information, the Securities and Exchange Commission plays an integral role in this data quality circus.
EDGAR Search Tools make it easy to navigate and download the Interactive XBRL Data. While the data quality is still not up to par for normalization and comparability, it's a great tool for quick glances of the data and looking straight back through to the source.
FASB
The Federal Accounting Standards Board (FASB) is responsible for developing and communicating the US GAAP Financial Reporting Taxonomy.
FASB accounting experts conduct in-depth research into the XBRL and taxonomy space. In addition, they pursue projects focusing on recognition & measurement, presentation & disclosure, and framework. Employees at FASB are experts when it comes to the intricacies of financial statement construction and reporting.
New projects include an "anchoring" system that would "anchor" random extensions to a standardized tag.
AICPA
The American Institute of CPAs is another organization heavily involved in the XBRL space. The AICPA does a great job of promotion and education of XBRL, and regularly hosts events and publishes research.
What Does This All Mean for Me?
If You're a Developer
Trust us when we say that raw XBRL data is not ideal for building applications. We know because we tried. We originally attempted to build a valuation engine at Intrinio, before we realized how terribly expensive and useless raw financial data is. We tackled the data project instead, and we've enjoyed seeing our data come alive in your applications so much that we stuck with it.
Intrinio is a safe haven for fintech developers. Our data feeds come in clean, standardized, normalized and comparable. This means that when you integrate with our Web API, the data runs smoothly through your app or website. Our data solutions are affordable and come with flexible redistribution rights.
If You're an Investor
If you're a professional investor, you are undoubtedly severely overpaying for a large data firm to manually standardize and dish up your data. The Intrinio platform is a modern and up-to-speed solution for accessing quality data that won't break your bank.
Our fundamental data is fully standardized and comparable. Rest assured that your investment decisions are based on quality, comparable, timely, and affordable data.
Ready to get started? Explore our data packages.

.jpg)