A Quant Quickstart with Intrinio & Backtrader
Hello, my name is Leo Smigel, and I use data science to determine what works in investing and trading. You can read more about me and my journey at Analyzing Alpha. My goal is to be the resource I wish I had when learning how to make money in the markets.
I remember the daunting feeling of venturing into the world of algorithmic trading and backtesting. So don't worry, I'm going to provide step-by-step guidance so you can follow along.
With introductions out of the way, let's dig into the what and then the how.
What is Backtrader?
Backtrader is an open-source Python trading and backtesting framework. The primary goal of the platform is ease-of-use, but don't mistake the ease of use for lack of power. It's incredibly powerful. I've used several systems in the past, and now I'm focusing on using Backtrader more than ever. It's also object-oriented, which will help new Python developers improve their programming skills. The reason I'm going into these details is that I'm often asked: "Am I learning the right platform? Can I scale with it?" The answer is yes, and yes. With that out of the way, let's move on to Intrinio.
What is Intrinio?
Since you're already on this blog, you're likely already familiar with Intrinio, so I will keep it short. Still, it may be helpful to get a third-party opinion on Intrinio and why I opted to use them.
Before using Intrinio, I had multiple data providers with many subscriptions. Intrinio was able to provide what I needed at a better price point. That's what got me started with Intrinio. What keeps me with Intrinio is that they care about their customers. I don't feel like "just a number" anymore, and there's even a community to ask for feedback/help. How many other data providers have that? Exactly...
What is a Crossover Strategy?
A crossover strategy is a strategy that tries to ride the prevailing trend. To give a more specific example, a Golden Cross occurs when a 50-period moving average moves above the 200-period moving average. It's called a Death Cross when the 50-period moves below the 200-period average. A simple moving average is simply the average price over the last x periods. In our case, we’ll be using the 1-day and 4-day periods for our crossover. If you want to test out the results of a Golden Crossover or a Death Cross, you’ll likely want to get a reliable data feed. I suggest subscribing to Intrinio’s market data.
Here's a visual example of a Golden Cross occurring with Apple:
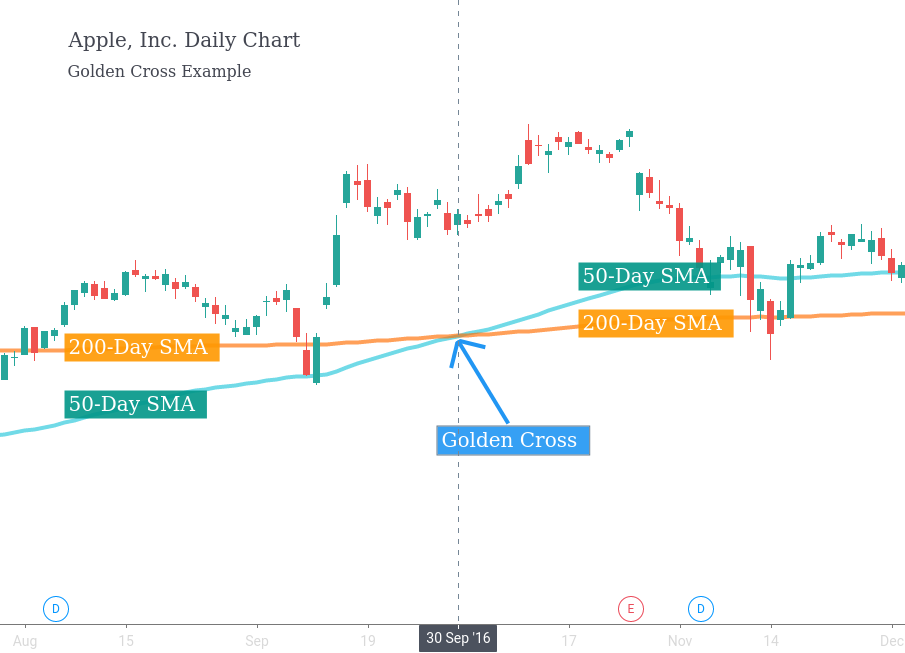
With the necessary background covered, let's get to it!
Installation
Getting everything installed may be the hardest part of this post for new algorithmic traders, so bear with me. The good news is that once it’s done, it’s done, and there are a lot of great resources online to help with this. I’ll do my best to cover the standard installation, but I won’t be able to cover every case. For those, you’ll have to search online. The good news is that there are tons of resources for general Python assistance, and both Intrinio and Backtrader have helpful user communities!
I'm going to assume you have Python installed on your machine. If you don't, that's okay. Real Python provides an excellent Python installation guide.
We'll use pip to install all of the packages into a virtual environment that we create. Creating a virtual environment allows us to compartmentalize our various Python programs. This way, we don't break one program as we update another. This may not be an issue for new Python developers, but trust me, it'll quickly become one.
Here are the steps we'll take to install Backtrader & Intrinio:
- Create a virtual environment
- Install Backtrader & Intrinio
- Test the installation
Creating the Virtual Environment
Open up a terminal and create a virtual environment named env and then activate it.
For Windows Users:
For Mac & Linux Users:
Activating the Virtual Environment
For Windows Users:
For Mac & Linux Users:
If you run into any issues or are looking for more information, read creating a virtual environment.
Install Backtrader & Intrinio
Next up, we'll use the terminal to install Backtrader and Intrinio's Python SDK using pip:
Get an Intrinio API Key
To get the Apple data from Intrinio, you’ll need to get an API key. Intrinio provides a great getting started guide.
Test the Installation
Create a file named test.py and add the following:
The above code will import Backtrader and print out the starting and ending cash. We haven’t created a strategy yet so our starting and ending balances will be the same.
It should output the following:
If it ran without error, you’re all set. If you run into any problems, you’ll want to check your Python and pip installations.
With the installation of Python and our virtual environment out of the way, let’s move on to the data.
The Data
We’re going to grab daily close pricing data for Apple using the shiny new Intrinio API key. We’ll be using the sandbox version so everyone can follow along. If you skipped right to this section because you’re already familiar with Backtrader, make sure you’ve got your Intrinio API key.
While I highly suggest experimenting with APIs when you’re just starting, we’ve got an end-game. Backtrader expects the format of our pricing data to be in OHLCV format.
Understanding the Data
OHLCV is just a shorthand for each row containing the following using closing price data:
- Date
- Open
- High
- Low
- Close
- Volume
The good news is that Intrinio provides this for us and more. Click on the Intrinio documentation link Stock Prices by Security and scroll down to the StockPriceSummary area. We will ask the Intrinio API for the Apple data, and then we’ll massage it into the OHLCV format needed. Let’s do that next.
Querying the API
Before we start writing a trading algorithm, new Python programmers often find it helpful to run commands using the Python interpreter. To do this is easy. Simply type your Python command when using the virtual environment created above. I’ll use the Linux/Mac commands for example purposes, but you can use the Windows commands shown above if needed:
You should see output similar to the following and now be able to enter Python commands:
Let’s first import Intrinio so we can use it. You’ll want to type the following:
If you receive an error stating that intrinio_sdk is missing, make sure you’ve correctly activated your virtual environment.
With the Intrinio SDK loaded, we just need to add the API key. You can find your API key on the Intrinio Account page. I’ve purposely substituted my API key with the fictitious alphabet key below to make sure someone else doesn’t accidentally use up all of my API calls!
Store your Intrinio api key into the apikey variable:
Next, we’ll configure the Intrinio SDK to use your key:
We’ll then grab the security_api so we can get data from Intrinio’s Securities database:
And finally, we’ll get the Apple data!
The api_response will contain the Apple data, which is a StockPriceSummary object provided by Intrinio. If you’re new to Python, I suggest reading the Intrinio Stock Prices by Security documentation and also typing in api_response. and then hitting tab in the Python interpreter to see all of the various options you have and experimenting with them.
Now let’s get our data into OHLCV format. We’ll use the adjusted values to incorporate dividends, splits, and other corporate actions.
Let’s create Python code to loop through the price data provided by the API and save it in OHLCV format. We’ll create a list called prices and add only the information we need to it.
Let’s take a quick peek at the data to see if it is indeed in the format we want:
This returns the most recent two rows in our data:
With the data formatted the way we need it, let’s reverse the order from oldest to newest, and save it to a comma-separated value file (csv) file in the same directory named apple.csv.
You should now have apple.csv saved on your computer. It will be in the same directory where you started the Python interpreter.
Congratulations! You’ve successfully installed Python, created a virtual environment, grabbed data from Intrinio through an API, and saved the data to a CSV file on your computer. The hard work is over! We’ve got one more item on the agenda to discuss: creating a strategy in Backtrader.
The Crossover Strategy
Now that we have data from Intrinio organized in just the right manner, it’s time to code up the strategy in Backtrader. We’ve already coded most of what we need in the Python interpreter so I’m going to provide the code in its entirety below with comments explaining what is going on in Backtrader. If you need step-by-step guidance or are interested in other backtesting topics, check out Backtrader.
To save time, you can download the code directly for this algo strategy.
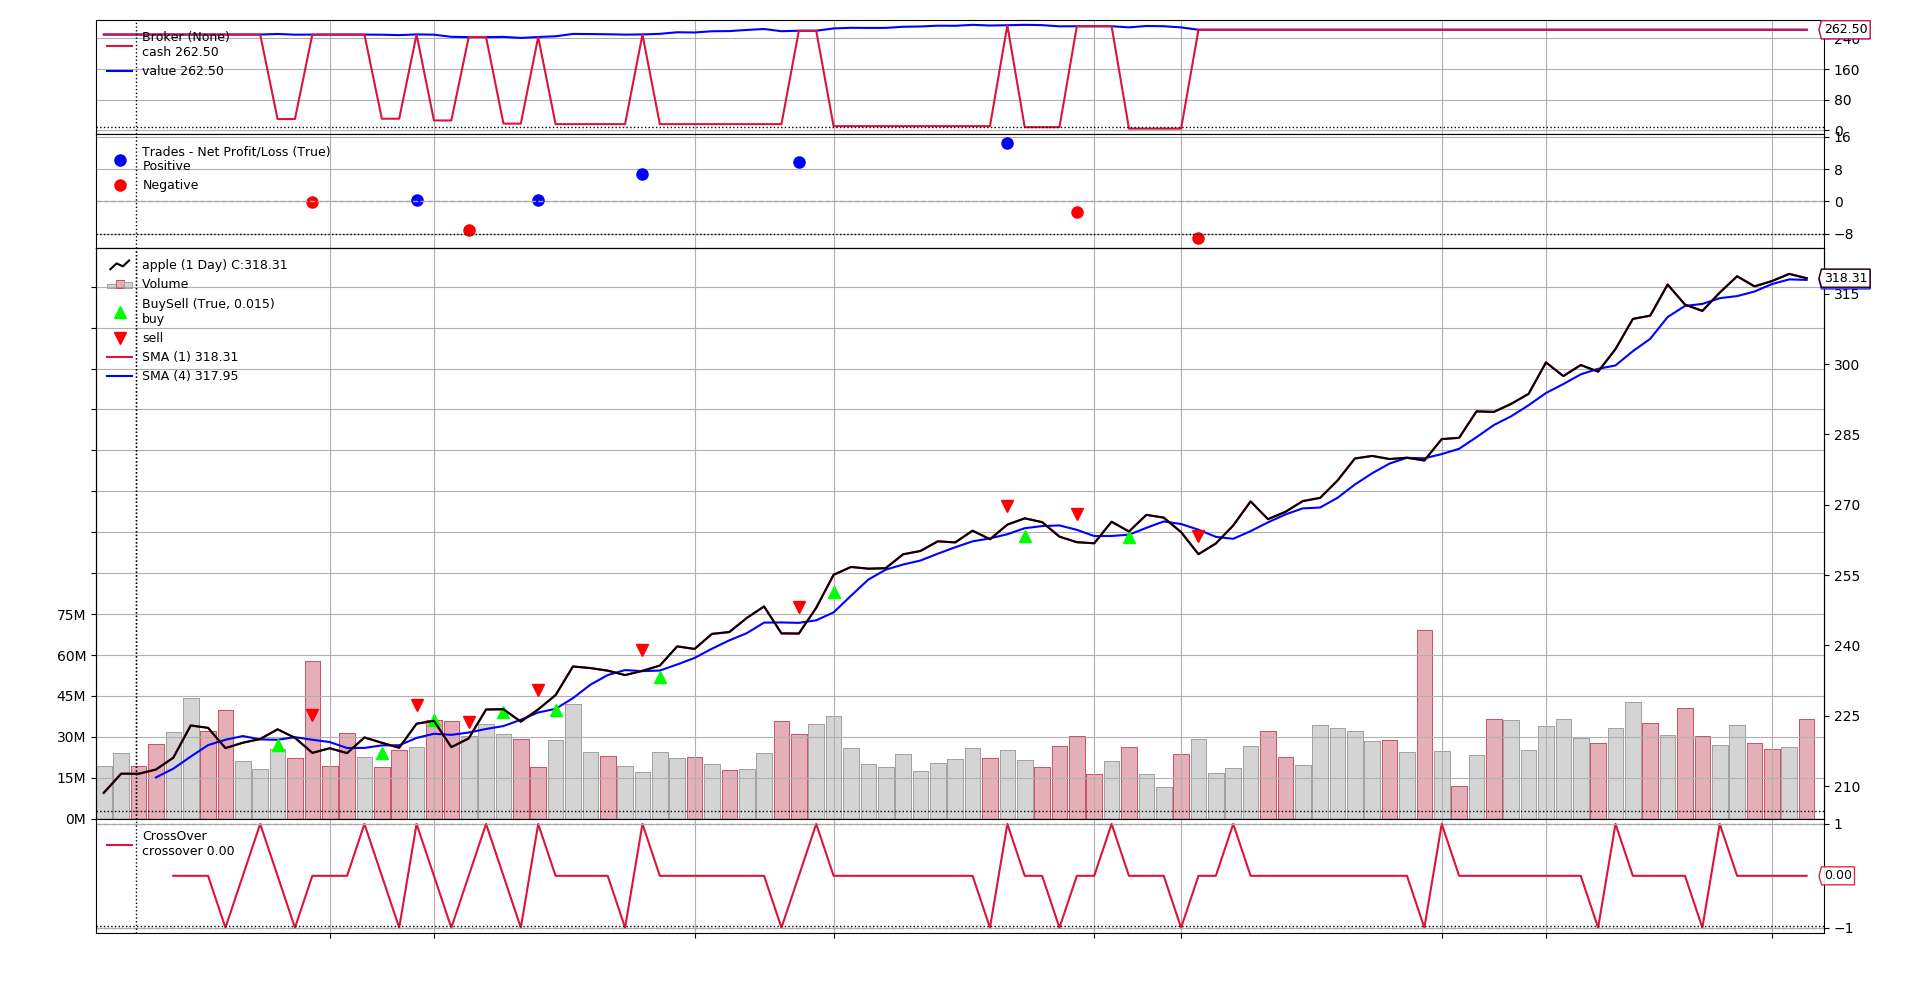
When you run your code successfully, you should get output similar to the following on a terminal and a graph analyzing the trading activity.
Congratulations & Next Steps
If you made it this far and you’re just starting out with algorithmic trading and backtesting, congratulations! You’ve installed Python, created a virtual environment, imported data from the Intrinio API, organized that data into a csv file, and ingested that data into Backtrader to see how the strategy performed. In other words, you’ve made a huge step on what is a long, fun, and often profitable journey. Want to continue? Read part 2.
I hope you found this quickstart useful. If you’re interested in continuing this journey with me, please visit my blog where I discuss what I wish I would have known before starting algorithmic trading.
New to Intrinio? Visit intrinio.com to learn more.
.jpg)
.jpg)
.jpeg)
.jpeg)

.png)